The SCORE Analyzer software is an artificial intelligence computer software designed to provide an aid to clinical decision-making in refractive surgery for the early detection and follow-up of keratoconus. It was designed by Dr Damien Gatinel and Alain Saad between 2009 and 2011, and obtained the CE mark in December 2013. It is based on the results of a clinical research study using Orbscan topography data (Bausch & Lomb, Technolas PV, Germany). A website is dedicated to the presentation of the SCORE Analyzer content and capabilities.
Choice of a relevant clinical model
Forme fruste keratoconus is defined by some authors as very early subclinical keratoconus, in which the deformation of the anterior surface of the cornea is not sufficiently pronounced to suggest the presence of keratoconus and the values of the various indices used for keratoconus screening are situated below the defined threshold and limit of detection. Some indices of detection use either Placido topography, elevation topography, but not into combination. The combined use of data obtained by corneal elevation topography, providing complementary data concerning the posterior surface, and corneal thickness data, should achieve a higher sensitivity for the detection of forme fruste keratoconus. What techniques can be used to study the topographic characteristics of eyes with forme fruste keratoconus? Theoretically, old topographic maps, performed at an early stage of the disease could be analysed retrospectively for eyes currently presenting clinical keratoconus, in the hope of revealing the first signs of this disease. However, in reality, patients are rarely investigated by corneal topography in the absence of visual symptoms and any warning signs on biomicroscopic examination. Another clinical model can be used to detect the earliest forms of keratoconus: the fellow eyes of patients with highly asymmetric keratoconus between the two eyes, i.e. advanced (clinical keratoconus and/or documented topographic keratoconus) in one eye and very early keratoconus in the fellow eye (i.e. objectively subclinical, with negative screening based on Placido topography indices). Only the less severely affected eye was included in the group of interest of our clinical model when Placido topographic screening tests (e.g. Klyce/Maeda criteria) were negative, i.e. automatic classification by neural network (Corneal Navigator, OPDSCAN topographer, Nidek, Japan) provided strictly zero percentage similarities for the objective topographic diagnosis of clinical keratoconus, keratoconus-suspect and pellucid marginal degeneration, while the other eye tested positive for the diagnosis of clinical keratoconus.
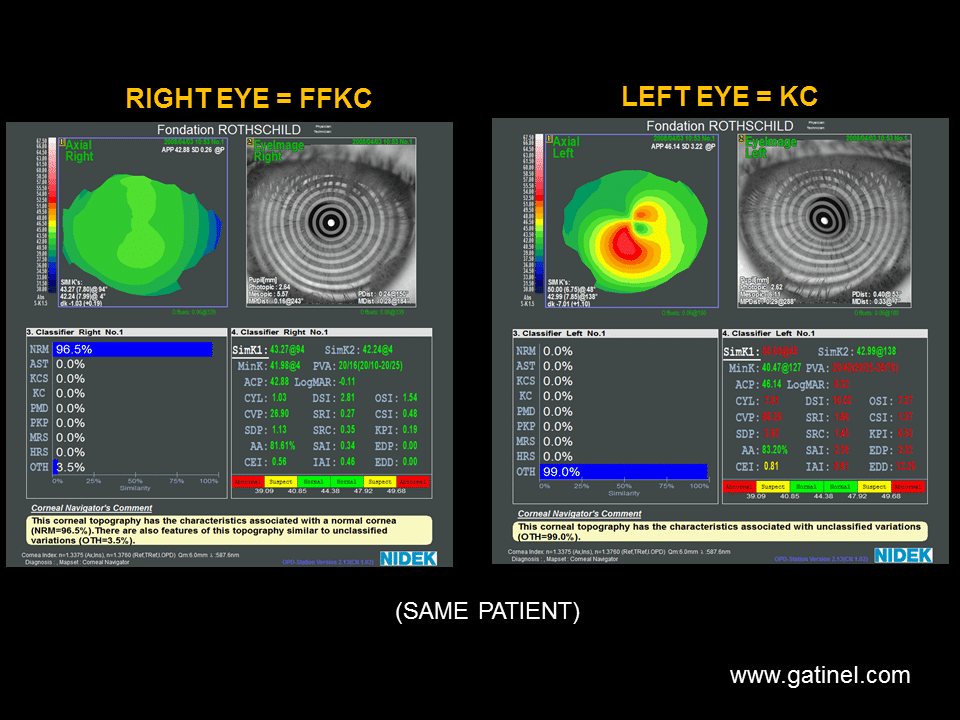
This is a very useful clinical model, as it can be used to constitute a group of eyes definitely corresponding to an early form of subclinical keratoconus (due to the documented keratoconus observed in the fellow eye) (1). Most authors deny the existence of strictly unilateral forms of keratoconus (2, 3). However, the author of this website has acquired the conviction that eye rubbing (or any source of repeated corneal friction) is necessary to develop the condition called « keratoconus ». It may be more relevant to improve the sensitivity of a test to include eyes diagnosed as “normal” rather than eyes diagnosed as “keratoconus-suspect” with such Placido-based topography data. In the presence of « keratoconus-suspect » verdict, the indication for corneal refractive surgery may need to be reconsidered, which then raises the problem of whether or not this suspicion is justified and not excessive (false-positive). The eyes included in our model resembled those that raise diagnostic problems in the context of preoperative assessment prior to refractive surgery : they presented several minor abnormalities, but situated below the classical topographic limits of detection (4).
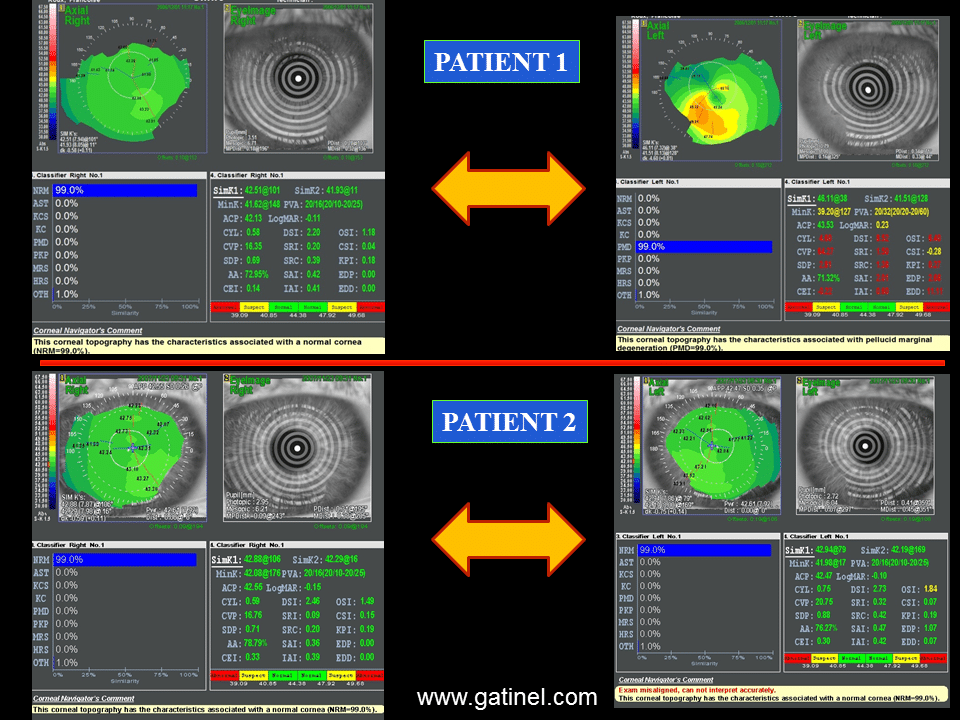
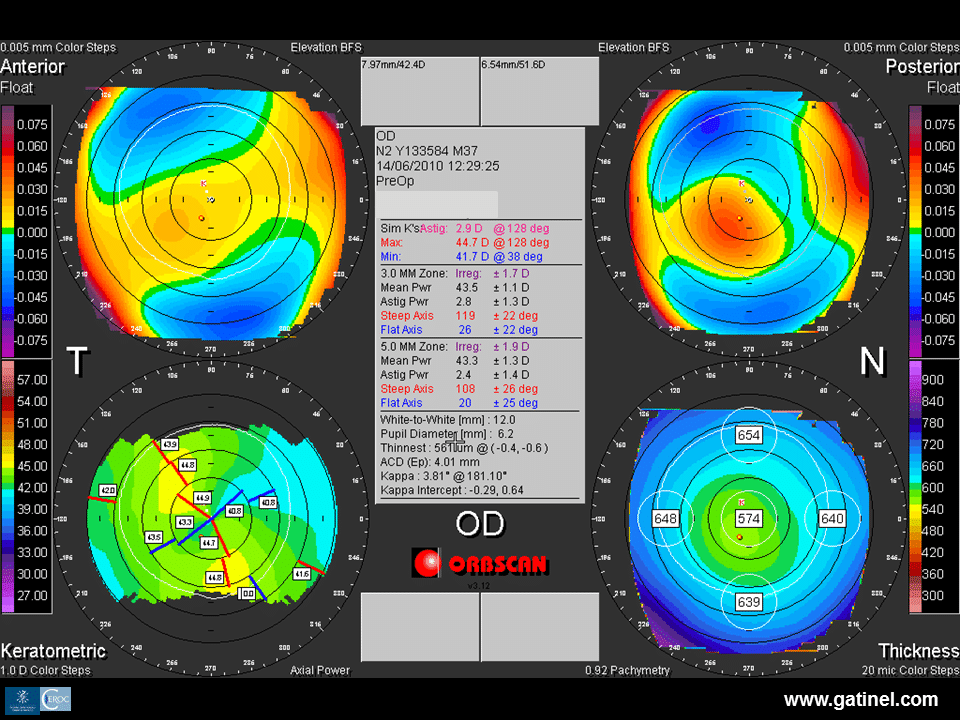
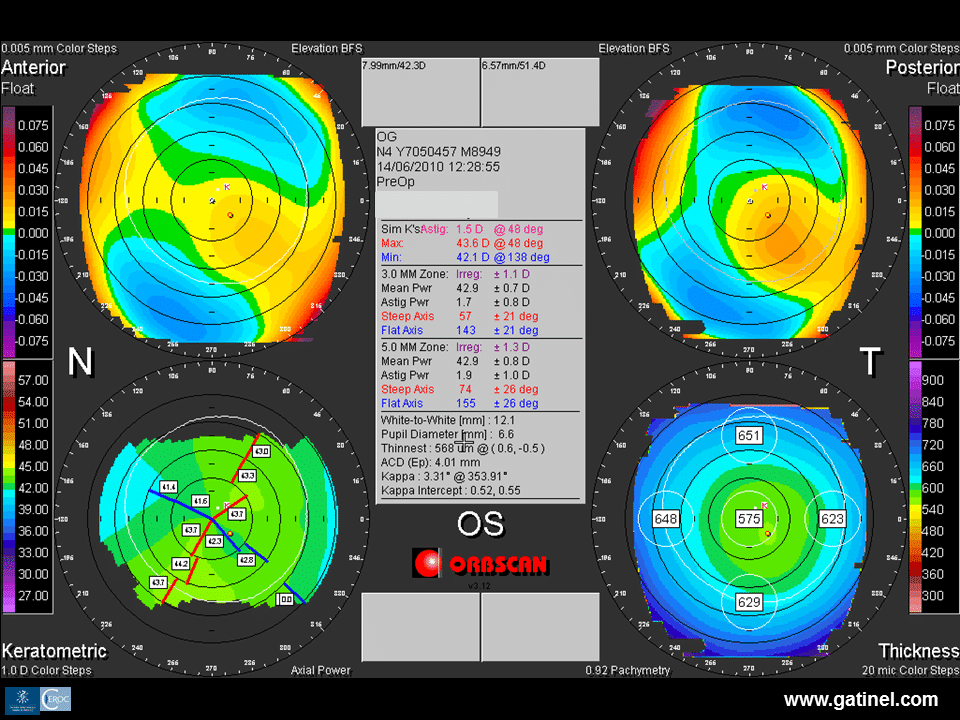
Patient 2 is asymptomatic and presents slight inferior nasal steepening in the right and left eyes. In the right eye, all indices are normal and, in the left eye, only the OSI is suspicious, but neural network analysis classifies both corneas as normal (NRM). The corneal topography of the right eye of patient 2 strongly resembles that of the right eye of patient 1. Although there may be a doubt concerning a possible forme fruste keratoconus in the corneas of patient 2, the presence of forme fruste keratoconus can be confirmed in the right cornea of patient 1. Other screening indices for forme fruste keratoconus can be defined and tested by using data derived from elevation topography and total pachymetry such as those provided by Orbscan for this type of cornea.
A clinical model based on the study of the less severely affected fellow eye in subjects with highly asymmetric lesions between the two eyes has been used by many authors (5-8). In view of the rarity of apparently unilateral forms of keratoconus (2, 3), the constitution of a sufficient sample size of eyes known to present forme fruste keratoconus (negative for currently available tests, while the contralateral eye presents keratoconus) proved to be a difficult process: it took us almost 10 years to recruit a sufficiently large sample.
Discriminant function analysis
“Placido normal” corneas in patients with a keratoconus genotype (documented lesion in the contralateral eye) were studied by slit-scanning elevation topography (Orbscan, Technolas PV, Germany), and compared to a control group of healthy corneas in myopic patients operated by LASIK, who did not present any complications after 5 years of postoperative follow-up.
In these eyes with forme fruste keratoconus, many indices calculated from anterior elevation topography, posterior elevation topography and pachymetry were statistically different from those measured in normal eyes (1). The irregularity of curvature of the anterior corneal surface calculated in the central 3 mm was also significantly increased (0.98 ± 0.34 vs 1.25 ± 0.38 D). However, comparison of the distributions between the two samples (normal corneas vs forme fruste keratoconus) revealed a marked overlap of these values.
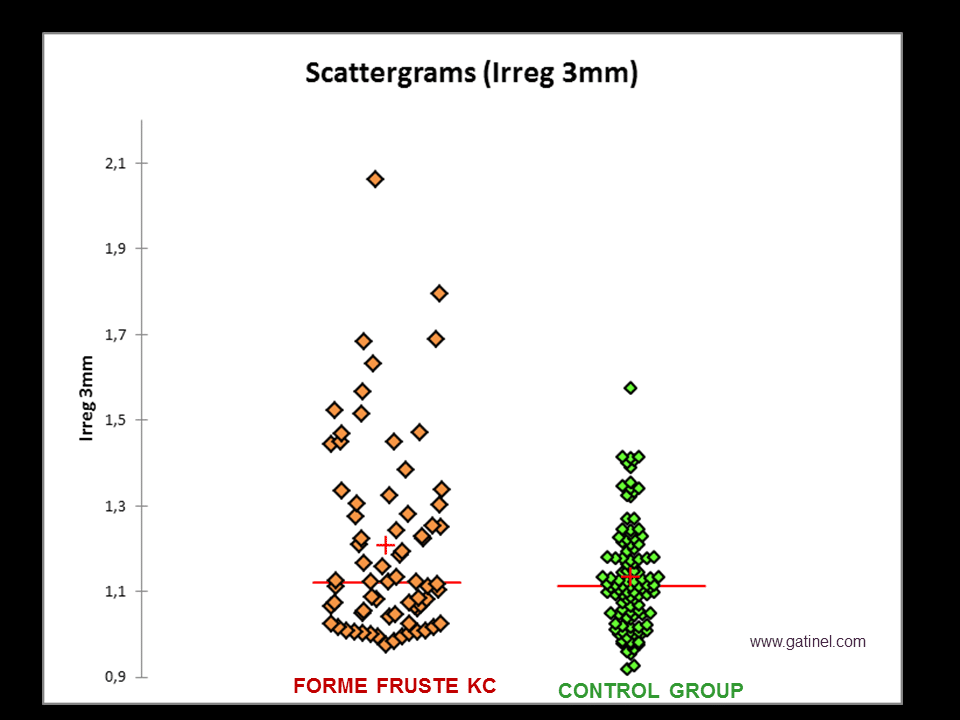
It is noteworthy that, despite the normal Placido indices, a statistical test performed between the group of corneas with forme fruste keratoconus and a group of normal corneas revealed a statistically significant difference for anterior curvature. Normal Placido indices simply mean that the values for the indices calculated for each of these corneas were situated below the cut-offs initially defined for these tests. In absolute terms, the average irregularity of the anterior corneal surface of forme fruste keratoconus remains statistically higher than that of normal corneas. However, the considerable overlap of the values observed in each cornea of the sample means that good sensitivity and specificity is unlikely to be achieved with a test exclusively based on this criterion using a lower cut-off. Statistically significant differences were also observed for other parameters: mean central corneal thickness was decreased (524.3 ± 35 vs 554.6 ± 36 microns), the difference between this value and that of the thinnest point was increased (12.1 ± 5.6 vs 6.8 ± 3.1 microns), the distance from the geometrical centre of the thinnest point was increased (0.95 ± 0.37 vs 0.64 ± 0.32), and the posterior elevation in relation to the reference sphere calculated after recentering on the thinnest point was greater over this point (26.3 ± 11 microns vs 19.7 ± 8.6 microns). The thickening gradient of the corneal wall towards the periphery was more marked than in normal corneas. An equivalent, but more clinically relevant interpretation of this criterion is that it reflects steeper thinning from the periphery towards the centre. Although the respective values for the apical curvatures of the anterior and posterior surfaces were not significantly different between the two groups, a significant difference was nevertheless observed for the local variation of these curvatures, which was steeper in the paracentral zone and mid-periphery for corneas with forme fruste keratoconus. As indicated above, although the mean values calculated for each of these parameters were significantly different, in view of their overlap, they cannot be considered to be clinically significant and cannot be used, on their own, as the basis for a sufficiently sensitive and specific screening test. Nevertheless, the thinning gradient of the cornea from the periphery to the centre, the topographic irregularity index at 3 mm, the vertical decentration of the thinnest point, the difference between central pachymetry and the thinnest pachymetry, as well as the difference between mean inferior keratometry and mean superior keratometry measured 5 mm from the vertex are indices that have been demonstrated to be potentially discriminant. However, isolated use of each of these indices is unable to differentiate, with sufficient sensitivity and specificity, normal corneas from the corneas of the study group because of the considerable overlap of the values obtained for the corneas included in the sample. In contrast, combined use of these criteria, based on calculation of a composite index using a discriminant analysis technique (see chapter 11), resulted in a more sensitive and specific diagnostic test. The control group used to construct this test was composed of the eyes of myopic patients under the age of 50 years, operated by myopic LASIK with no complications (particularly corneal ectasia) after at least 5 years of follow-up. The study group was composed of eyes considered to be normal on Placido topography and neural network analysis based on Klyce/Maeda indices. However, these eyes can evolve spontaneously (and especially in the case of corneal surgery) to a form of ectasia. The choice of optimal cut-off resulted in a sensitivity of 93% and a specificity of 92% for the detection of forme fruste keratoconus
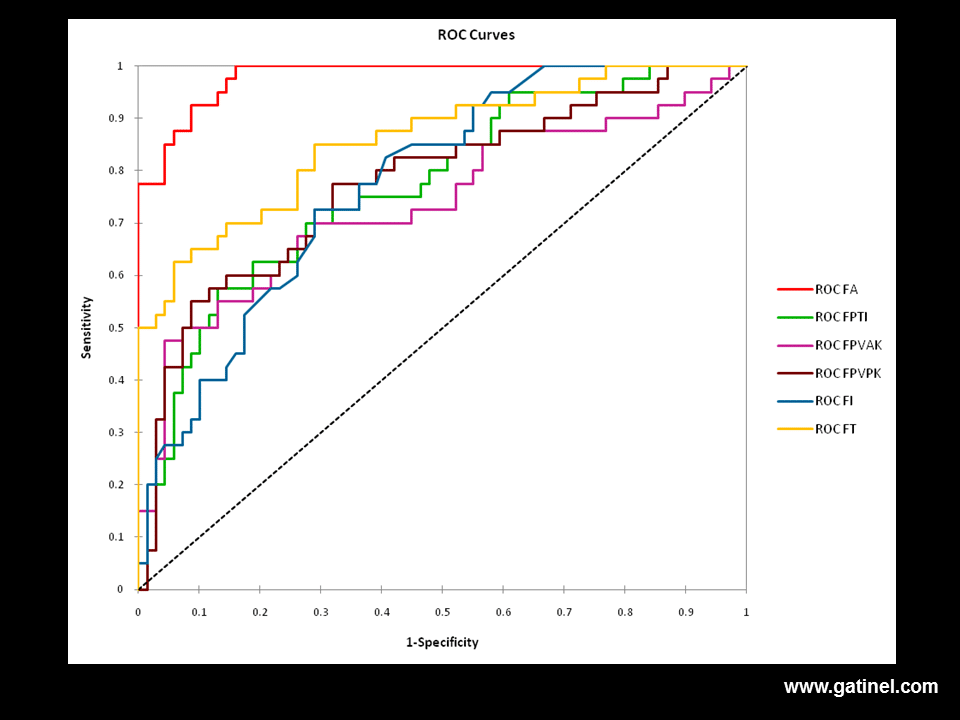
FA: All indices
FT: Elevation and decentration at the thinnest point
FPTI: Percentage variation of corneal thickness between the centre and the periphery
FPVAK: Percentage variation of anterior curvature between the centre and the periphery
FPVPK: Percentage variation of posterior curvature between the centre and the periphery
FI: Anterior irregularity at 3 mm and 5 mm
FA is the most sensitive and specific function (area under the curve = 0.98). The choice of an optimal cut-off provides a sensitivity of 92.5%, and a specificity of 92%
. These results constituted the basis for the design of a new algorithm, called SCORE Analyzer (SCORE: Screening Corneal Objective Risk of Ectasia) based on the use of a combination of Placido topography and corneal elevation indices presenting a certain discriminant property (statistically significant difference of the means calculated between the groups tested for each of these indices). Twelve of the most discriminant indices with a statistically significant difference between the two groups were included in the algorithm. Each of these indices contributed to calculation of the final score, based on linear discriminant function analysis. The score obtained can be used to classify cases according to the degree of similarity with corneas likely to spontaneously progress to ectasia (progression to a more pronounced form of keratoconus). The cut-off adopted, which corresponds to the limit allowing the two study samples to be discriminated with maximum sensitivity and specificity, was adjusted to take the “zero” value. A positive score (> 0) is predictive of keratoconus-suspect, while a negative score (< 0) is predictive of a normal cornea. The higher the positive score, the more closely the topographic characteristics of the cornea examined resemble those of keratoconus, and vice versa. The indication for corneal refractive surgery should be reconsidered in patients with a positive score, or even a slightly negative score, depending on the clinical context (high myopic correction, atopic predisposition, etc.)
Presentation of SCORE software
SCORE software uses data acquired with the Orbscan Placido-based and corneal elevation topographer. In its current configuration, data acquired by the Orbscan (*.exm file) must be exported in a proprietary format (*.ote) prior to import and analysis by SCORE software, which completes the classical Quad Map display by adding new quantitative indices.
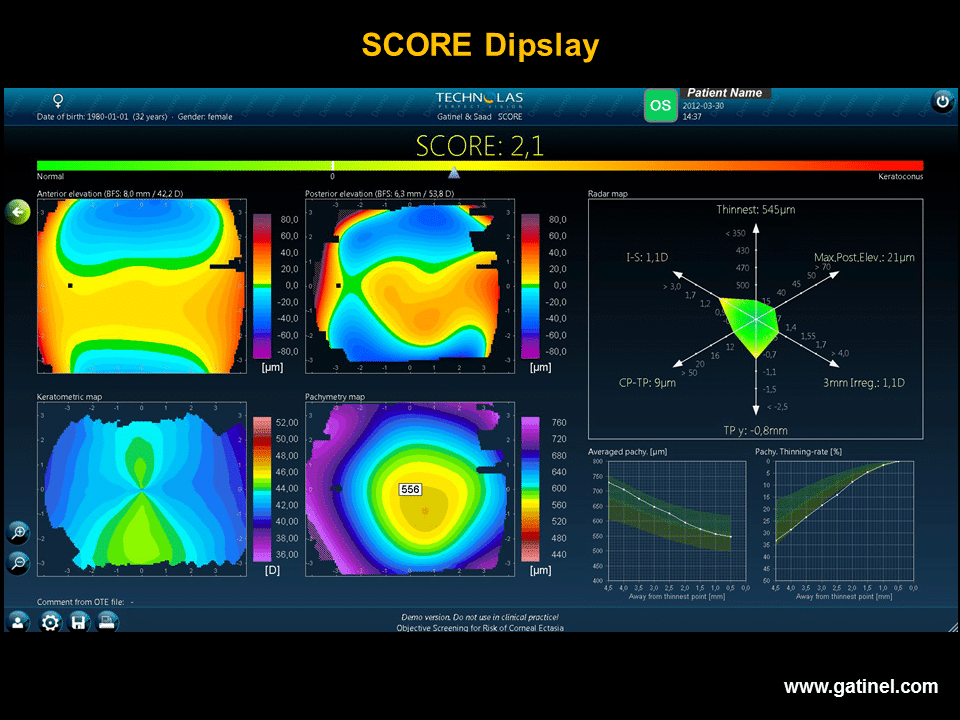
Particular importance is attributed to tomographic data (corneal thickness variations). Certain indices and the two pachymetric curves are calculated after recentering the data measured on the thinnest point. SCORE software should be used for screening of early subclinical forms of keratoconus in myopic subjects under the age of 50 years, who have never undergone refractive surgery (these characteristics are derived from those of the eyes included in the control group) (9). The Orbscan acoustic factor (allowing modulation of the corneal thickness value in relation to a standard such as ultrasound pachymetry) must be adjusted to a value of 0.92.
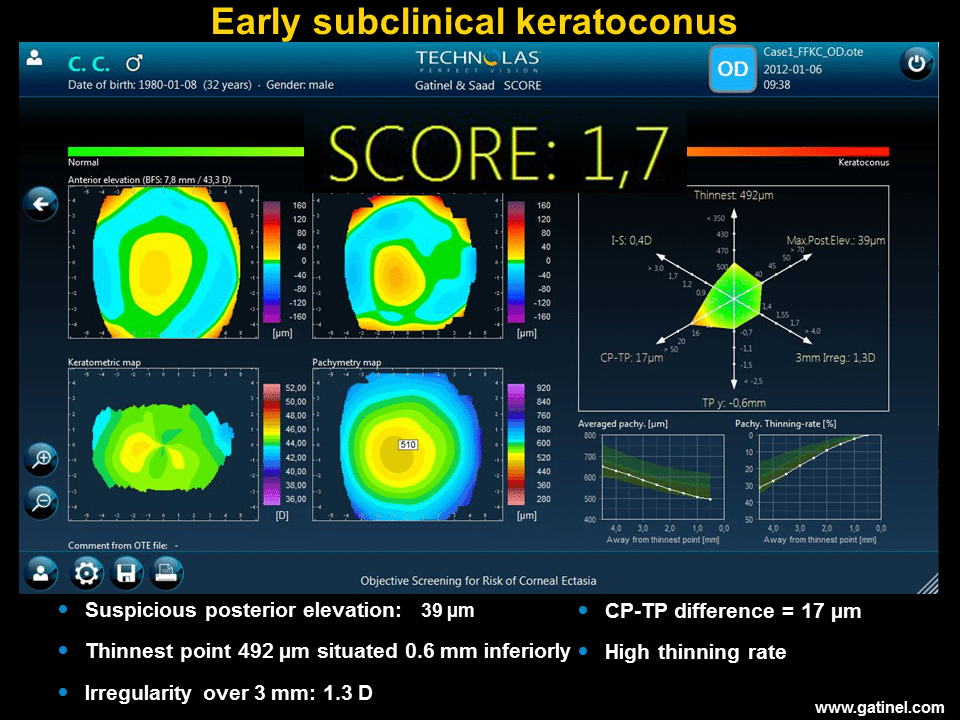
The score
The value of the score corresponds to the result of discriminant function analysis comprising 12 variables.

The optimal cut-off for specific and sensitive detection was determined on a ROC (Receiver Operating Characteristics) curve. It has been adjusted to correspond to a value of “zero. A negative value corresponds to a cornea considered to be free of forme fruste keratoconus. A positive value corresponds to a cornea considered to present forme fruste keratoconus. The absolute value of this score (corresponding to the “distance” from the cut-off) is indicative of the “normal” or “abnormal” nature of the cornea examined. LASIK corneal refractive surgery is not recommended in patients with a positive score.
Radar map
The radar map represents 6 of the most discriminant topographic indices used for calculation of the score.
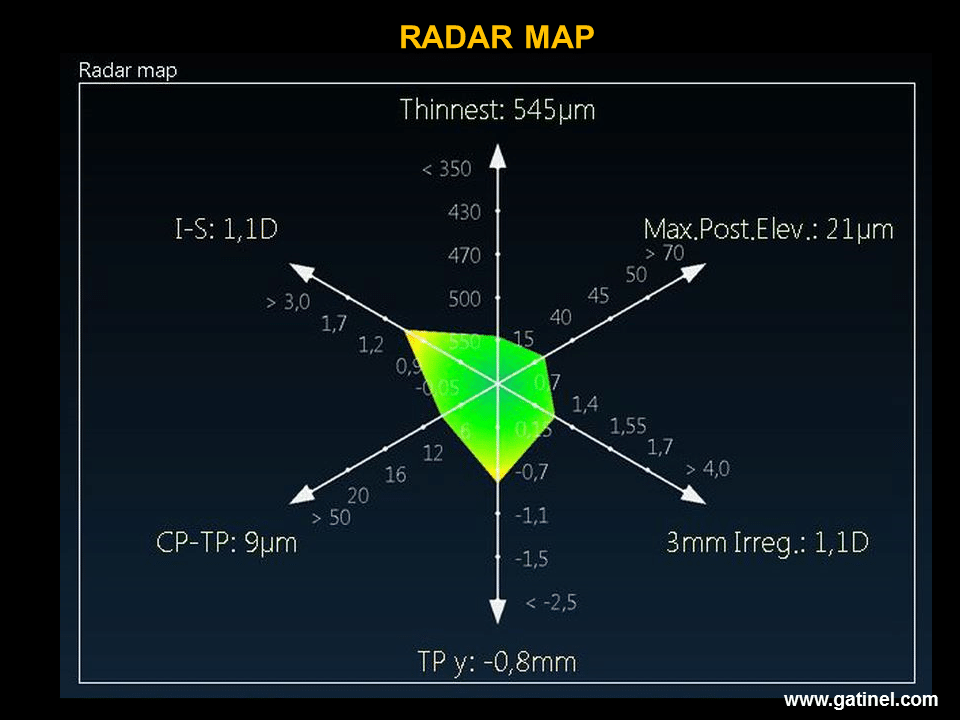
The values of each index are plotted on a half-axis, and the 6 half-axes are linked to each other so that the connected coordinates of each index form a polygon. A colour scale ranging from green to red allows rapid visual analysis of the results. Yellow corresponds to the cut-off value (mean plus or minus two standard deviations of a normal population). Variables used for construction of the radar map:
- Pachymetry of the thinnest point (microns), which corresponds to the minimum thickness of the corneal wall (using an acoustic factor of 0.92)
- Maximum posterior elevation (microns), which corresponds to the maximum distance between posterior corneal data and the calculated posterior reference sphere in the central 3 mm.
- Irregularity (dioptres) in the central 3 mm, which is proportional to the standard deviation of the values of local curvature of the anterior corneal surface.
- Vertical decentration of the thinnest point (mm), which corresponds to displacement of the thinnest point in relation to the geometrical centre of the cornea.
- Difference between mean central pachymetry (central zone 2 mm in diameter) and the pachymetry of the thinnest point.
- I-S value (dioptres), which corresponds to the difference between mean keratometric values of 5 equidistant points situated 1.5 mm from the vertex on the superior (S) and inferior (I) anterior corneal surface. It reflects the degree of vertical asymmetry of the anterior corneal surface.
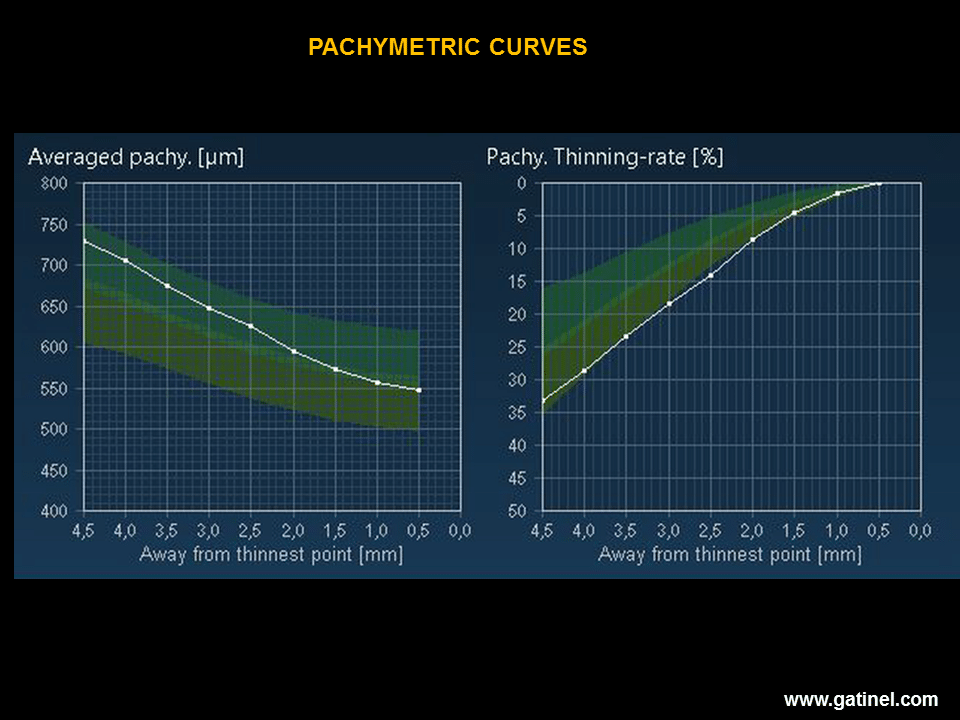
Pachymetric curves: mean thickness and thinning rate towards the thinnest point.
The mean thickness curve (average pachymetry) is composed of mean corneal thickness values from the periphery to the centre (thinnest point), according to 9 concentric rings 0.5 mm wide, contiguous from the periphery (9 mm in diameter) to the centre of the cornea (where the mean value considered is that of a central 1 mm disk centered on the thinnest point). The thinning rate curve corresponds to the thinning gradient of the corneal wall towards the thinnest point: each value is expressed as a percentage, reflecting the decreased thickness between two contiguous rings.
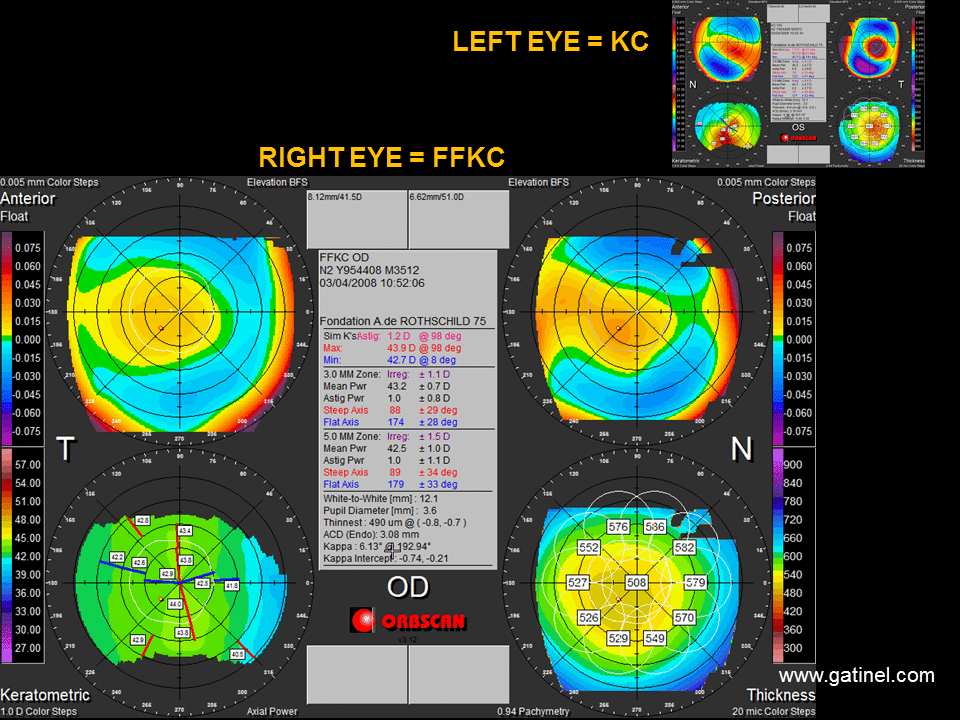
Examples of the use of SCORE software
This map resents an example of the map obtained from an Orbscan acquisition in a patient with a highly asymmetric form of keratoconus (the left eye presents clinical keratoconus).
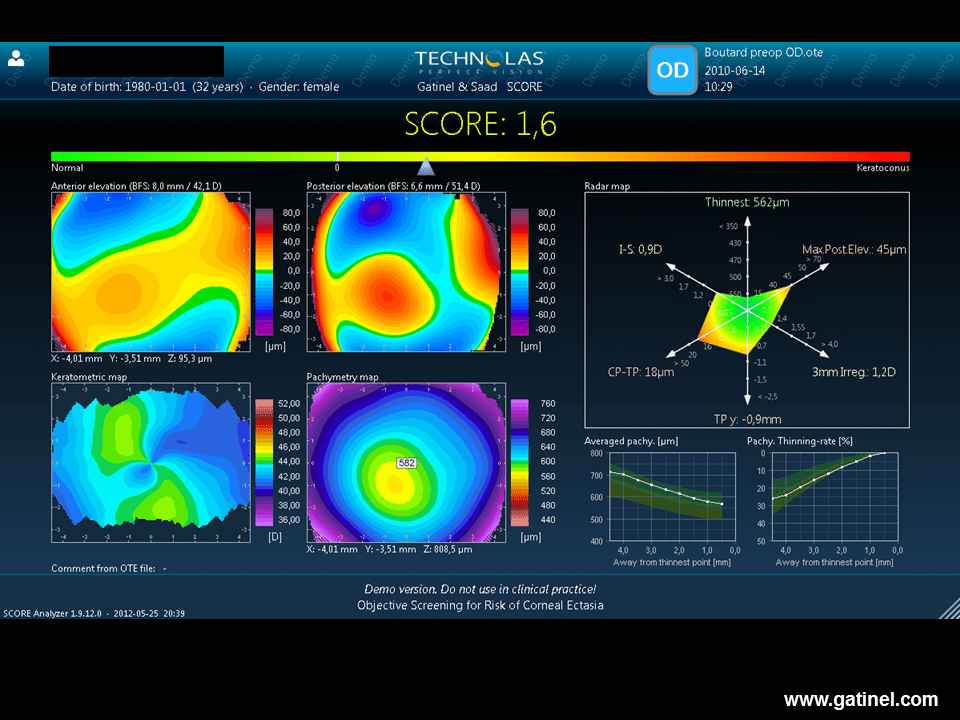
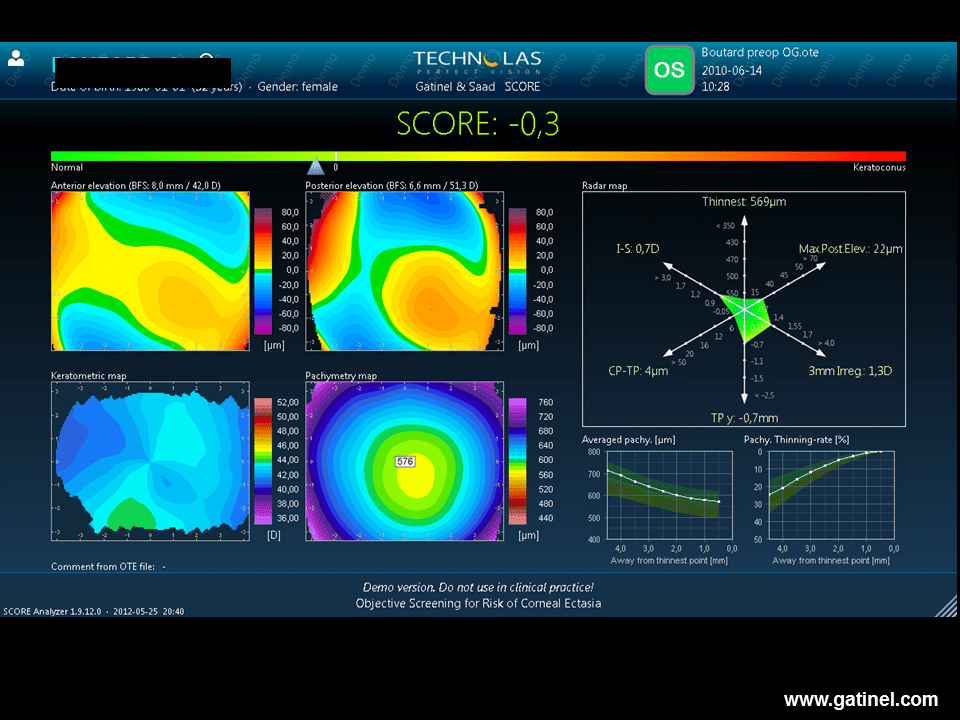
The following maps illustrate a case of post-LASIK iatrogenic ectasia, for which retrospective use of SCORE software showed a positive preoperative score.
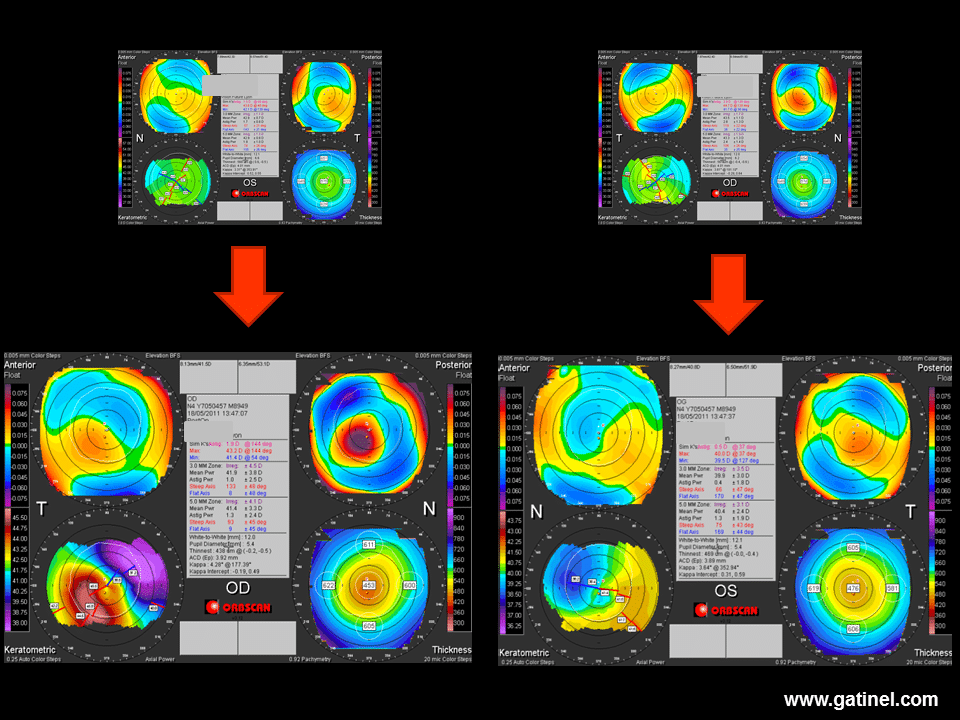
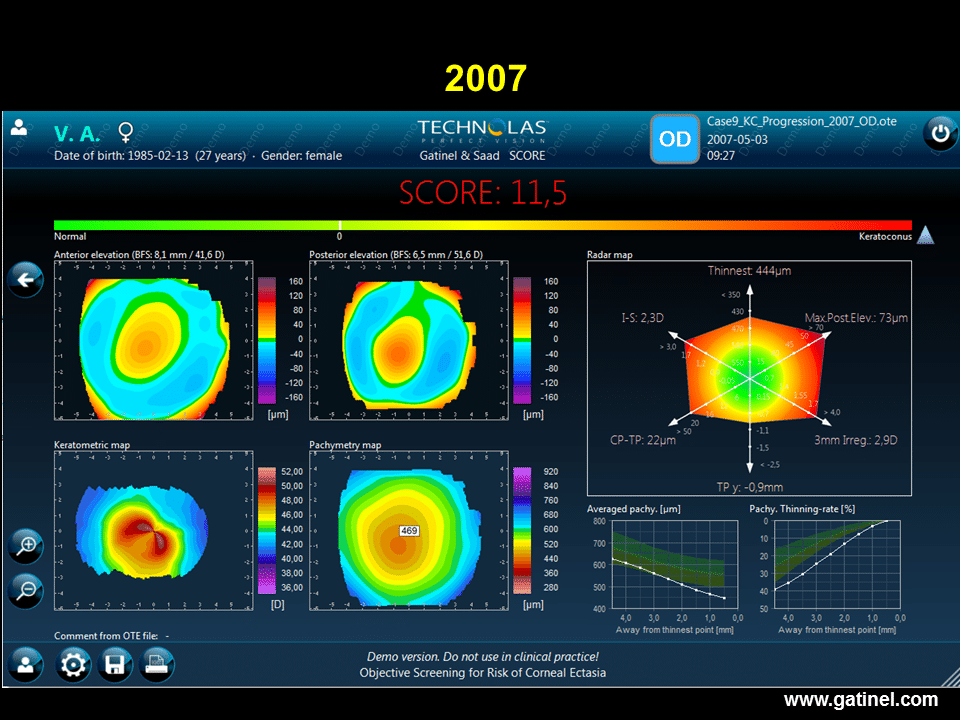
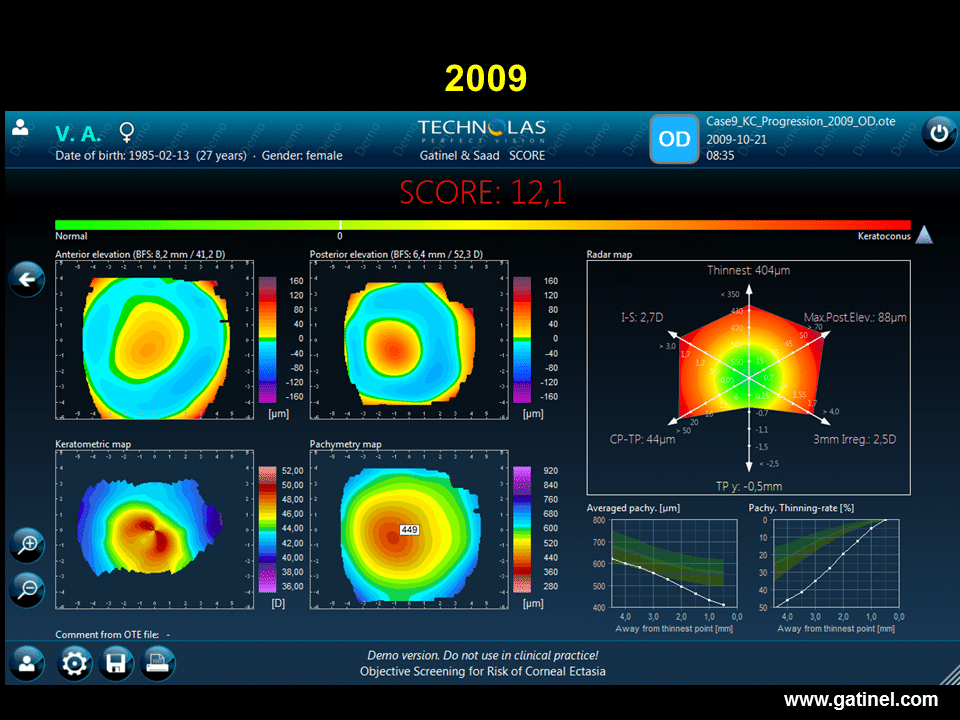
The following figures illustrate the potential value of calculation of a score to demonstrate progression of clinical keratoconus.
Value of SCORE software
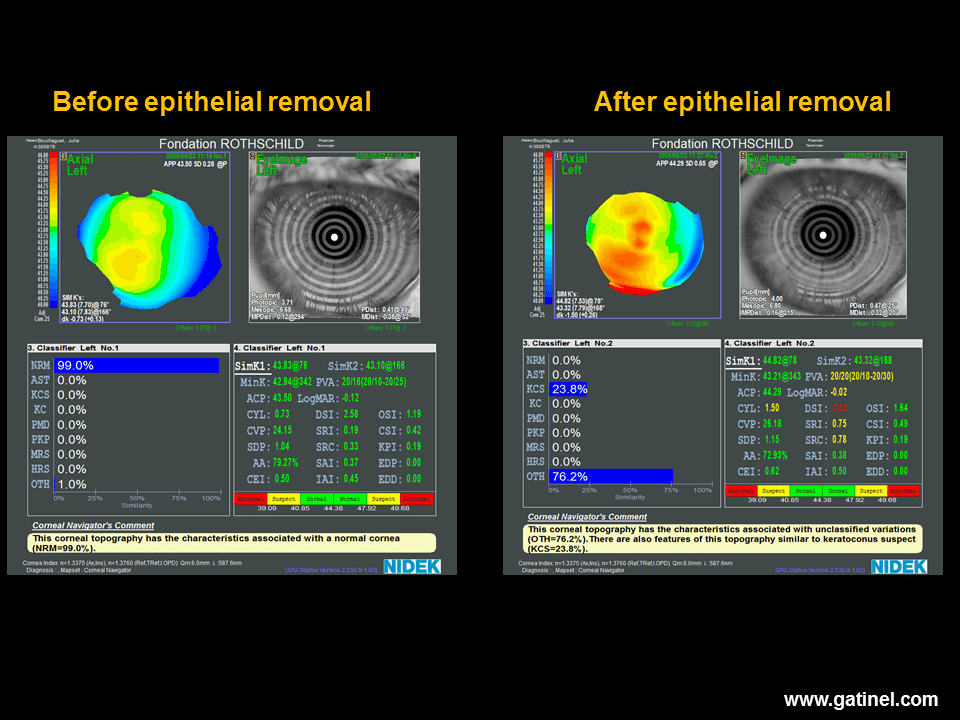
An automated topographic screening system for early subclinical keratoconus presents a number of advantages. First of all, it combines a set of discriminant indices derived from Placido topography, elevation topography and pachymetry in a single score, allowing more comprehensive assessment of each cornea. This is the first automated keratoconus screening method that combines Placido topography, elevation and pachymetric indices, and this combination has been demonstrated to be superior to the isolated use of only one of these two technologies (10, 11). The use of pachymetric and elevation data in this context is not surprising: keratoconus is a disease in which the cornea presents decreased thickness, or signs of thinning right from the early stages (12, 13). Progression of central or paracentral thinning is logically accompanied by modification of the anterior and posterior surface geometry (there is no reason why decreased central thickness would only affect one corneal surface). The results of our mathematical modelling study show that, when a normal cornea undergoes geometric changes towards an early form of keratoconus, such as increased apical steepness and prolate asphericity, the increase of central elevation of the posterior surface is greater than that of the anterior surface on classical mode. The posterior elevation map of the eye is redder in the centre; this appearance is frequently observed in keratoconus-suspect corneas. In our experience, a higher thinning rate (corresponding to downward displacement of the pachymetric curve on the right) and high posterior central elevation (index represented on the hemi-axis of the RADAR map) are parameters that must be taken into consideration and may require review of the indication for LASIK, particularly when central corneal thickness is less than the mean (e.g. close to 500 microns), and especially when the score is positive or slightly negative. A marked difference in plasticity is observed between the anterior cornea surface and the cornea posterior surface. The anterior corneal surface comprises a layer of stratified corneal epithelium. We formulated the hypothesis that epithelial masking or “smoothing” could tend to induce a normal appearance on anterior corneal topography (but obviously not on posterior corneal topography). We were the first to perform an in vivo series of Placido topographies of Bowman’s membrane, which is the smooth and reflective acellular stromal surface, situated just underneath the corneal epithelium (15). This examination was performed just after having carefully removed this epithelium in patients undergoing PRK for myopia. In almost every case, the surface of the cornea without its epithelium (superficial part of Bowman’s membrane) presented a topography more suggestive of keratoconus-suspect than the cornea with its epithelium: more prolate asphericity, increased toricity and more irregular curvature. This type of compensation is impossible on the posterior surface, which does not possess stratified epithelium.
SCORE software could also be potentially useful to quantify progression of keratoconus, which would be particularly useful to define the indications for a corneal stroma cross-linking procedure, and to assess the topographic improvement obtained. The SCORE Analyzer algorithm, which was developed and validated using the eyes of Caucasian individuals, was found to be valid and consistent in Asian eyes, showing good sensitivity and specificity in FFKC detection(16). The authors concluded that the algorithm was useful in objectively identifying eyes at risk of post-LASIK keratectasia. In another recent study, Reinstein et al assessed the effectiveness of a keratoconus-detection algorithm derived from epithelial thickness maps of the fellow eye from a series of patients with unilateral keratoconus and compared this algorithm to the SCORE analyzer and to the D score derived from a Scheimpflug device (Pentacam; Oculus) (17). This study included 10 patients with moderate to advanced keratoconus in one eye, but a clinically and algorithmically topographically normal fellow eye. Five of the 10 fellow eyes were classified as keratoconic by the algorithm derived from epithelial thickness mapping. Five of nine fellow eyes were classified as keratoconic by the SCORE model. For the five fellow eyes with available Pentacam analyses, none was classified by the Scheimpflug D score as keratoconic.
Conclusion
Corneal topography is a reference tool for the detection of subclinical forms of keratoconus. Placido topography is able to detect some of these subclinical forms (forms described as Placido-suspect), but its sensitivity and specificity are not sufficient and elevation and total pachymetry (tomography) data must be acquired. These convergent results strongly suggest that surgeons wishing to increase the sensitivity of detection of early subclinical keratoconus must pay particular attention to examination of the posterior corneal surface and its thickness, which is more globally evaluated by examination of the pachymetric distribution (tomography or pachymetry mapping). It is also reasonable to suppose that a more comprehensive assessment of elevation topography and pachymetry characteristics of Placido-suspect corneas would allow the diagnosis of keratoconus-suspect to be replaced by that of nonprogressive congenital asymmetry, i.e. identification of Placido topography false-positives, thereby eliminating some cases of Placido-suspect cornea.
References
- Saad A, Gatinel D. Topographic and tomographic properties of forme fruste keratoconus corneas. Invest Ophthalmol Vis Sci. 2010;51(11):5546-55
- Wei RH, Zhao SZ, Lim L, Tan DT. Incidence and characteristics of unilateral keratoconus classified on corneal topography. J Refract Surg. 2011;27(10):745-51
- Rabinowitz YS, Nesburn AB, McDonnell PJ. Videokeratography of the fellow eye in unilateral keratoconus. Ophthalmology. 1993;100(2):181-6.
- Gatinel D, Saad A. The challenges of the detection of subclinical keratoconus at its earliest stage. Int J Keratoco Ectatic Corneal Dis 2012;1(1):36-43.
- Muftuoglu O, Ayar O, Ozulken K, Ozyol E, Akıncı A. Posterior corneal elevation and back difference corneal elevation in diagnosing forme fruste keratoconus in the fellow eyes of unilateral keratoconus patients. J Cataract Refract Surg. 2013;39(9):1348-57
- Smadja D, Touboul D, Cohen A, Doveh E, Santhiago MR, Mello GR, Krueger RR, Colin J. Detection of subclinical keratoconus using an automated decision tree classification. Am J Ophthalmol. 2013;156(2):237-246
- Bühren J, Kook D, Yoon G, Kohnen T. Detection of subclinical keratoconus by using corneal anterior and posterior surface aberrations and thickness spatial profiles. Invest Ophthalmol Vis Sci. 2010;51(7):3424-32
- Fontes BM, Ambrósio R Jr, Salomão M, Velarde GC, Nosé W. Biomechanical and tomographic analysis of unilateral keratoconus. J Refract Surg. 2010;26(9):677-81
- Saad A, Gatinel D. Validation of a new scoring system for the detection of early forme of keratoconus. Int J Kerat Ect Cor Dis 2012;1(2):100-108
- Saad A, Gatinel D. Association of corneal indices for the detection of ectasia-susceptible corneas. J Refract Surg. 2012;28(3):166; author reply 166-7
- Saad A, Hodge C, Lawless M, Gatinel D. Retrospective testing of a new method for detecting ectasia-susceptible corneas. J Cataract Refract Surg. 2011;37(10):1907-8
- Ambrósio R Jr, Alonso RS, Luz A, Coca Velarde LG. Corneal-thickness spatial profile and corneal-volume distribution: tomographic indices to detect keratoconus. J Cataract Refract Surg. 2006;32(11):1851-9
- Ambrósio R Jr, Klyce SD, Wilson SE. Corneal topographic and pachymetric screening of keratorefractive patients. J Refract Surg. 2003;19(1):24-9.
- Gatinel D, Malet J, Azar ST. Corneal elevation topography: Best Fit Sphere, elevation distance, asphericity, toricity and clinical implications. Cornea, 2011;30(5):508-15
- Gatinel D, Racine L, Hoang-Xuan T. Contribution of the corneal epithelium to anterior corneal topography in patients having myopic photorefractive keratectomy. J Cataract Refract Surg. 2007;33(11):1860-5
- Chan C, Ang M, Saad A, et al. Validation of an objective scoring system for forme fruste keratoconus detection and post-LASIK ectasia risk assessment in Asian eyes. Cornea. 2015;34(9):996-1004.
- Reinstein DZ, Archer TJ, Urs R, et al. Detection of keratoconus in clinically and algorithmically topographically normal fellow eyes using epithelial thickness analysis. J Refract Surg. 2015;31(11):736-744.