Pre- and Post- LASIK aberrations with Standardized Zernike vs LD-HD wavefront reconstruction method
We present another case to highlight the difference between the Zernike and LD-HD (Low Degree/High Degree) wavefront decompositions.
As we will see in this case, the presence of Higher Order Aberrations (HOAs) not only result in an artefactual alteration of the low degree wavefront expression but reduces the accuracy of the higher order coefficient expression and subsequent retinal image metrics calculations.
We reviewed the case with the LD-HD method applied to the pre-and post-op data retrospectively when the patient attended our clinic. We wanted to assess if we could have predicted the issue this patient would experience post-op, prevented it as well as getting a better idea of their current visual performance, with the new LD-HD method.
Expanding on previous examples and applications, the LD-HD method has also been applied to the computation of the corneal wavefront: significant differences are shown with the Zernike method. These differences logically increase with the level of higher order aberrations.
This might have important implications regarding the clinical interpretation of wavefront analysis, and the design of custom wavefront and/or topography-guided photoablations.
A 7 mm pupil or corneal zone will be used for all the computations presented here.
All calculations were made using a pioneer software upgrade installed on the topographer & wavefront sensor Nidek OPD-Scan III.
++CASE DESCRIPTION++
PREOPERATIVE DATA
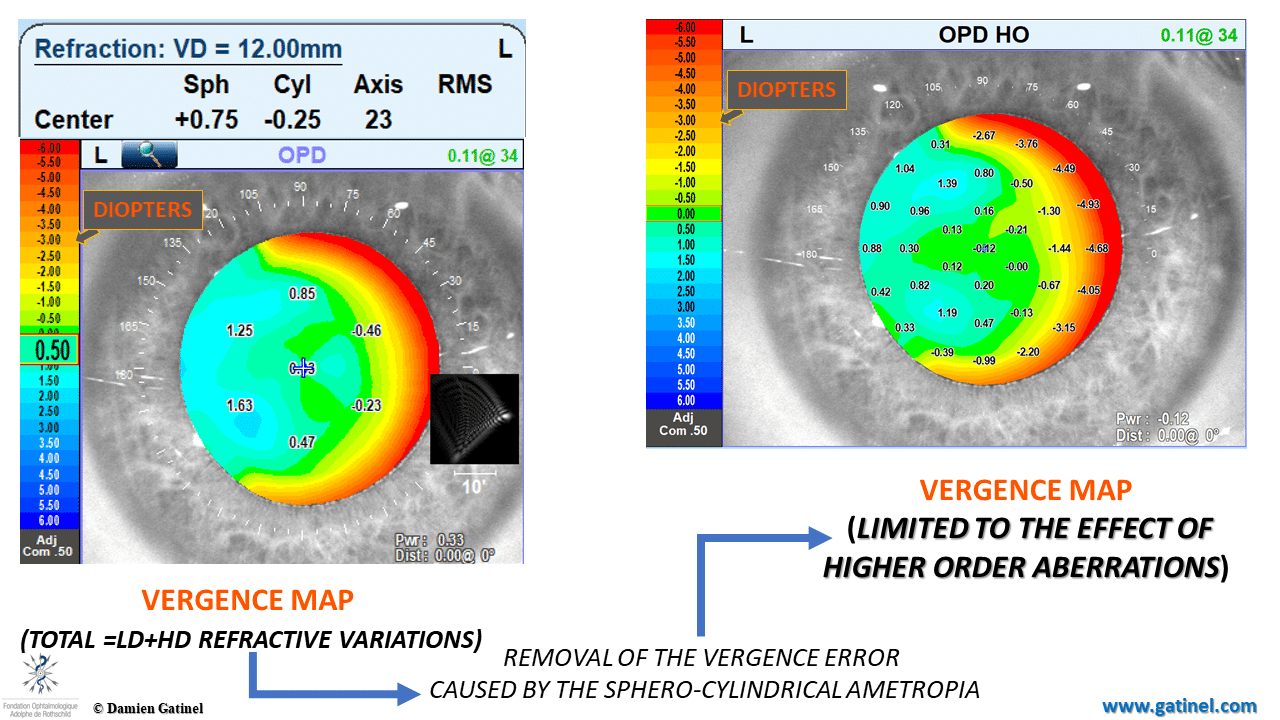
A 38 yo patient is scheduled for refractive surgery. The objective refraction as estimated from the OPDscan III is -8.00 (-0.25 x 179°). This instrument collects the total ocular wavefront data via automated skiascopy and is equipped with a Placido disk-based topographer to compute corneal topography data.
The vergence map on the left, called « OPD » displays the local fluctuations of the refractive error throughout the pupil area. It is expressed in Diopters, and provides more intuitive information regarding the effect of ocular optical imperfections than a wavefront error map. If the eye was free of higher order aberration, the OPD map would display a full zone of constant refractive error (or the lack thereof, in an emmetropic eye).
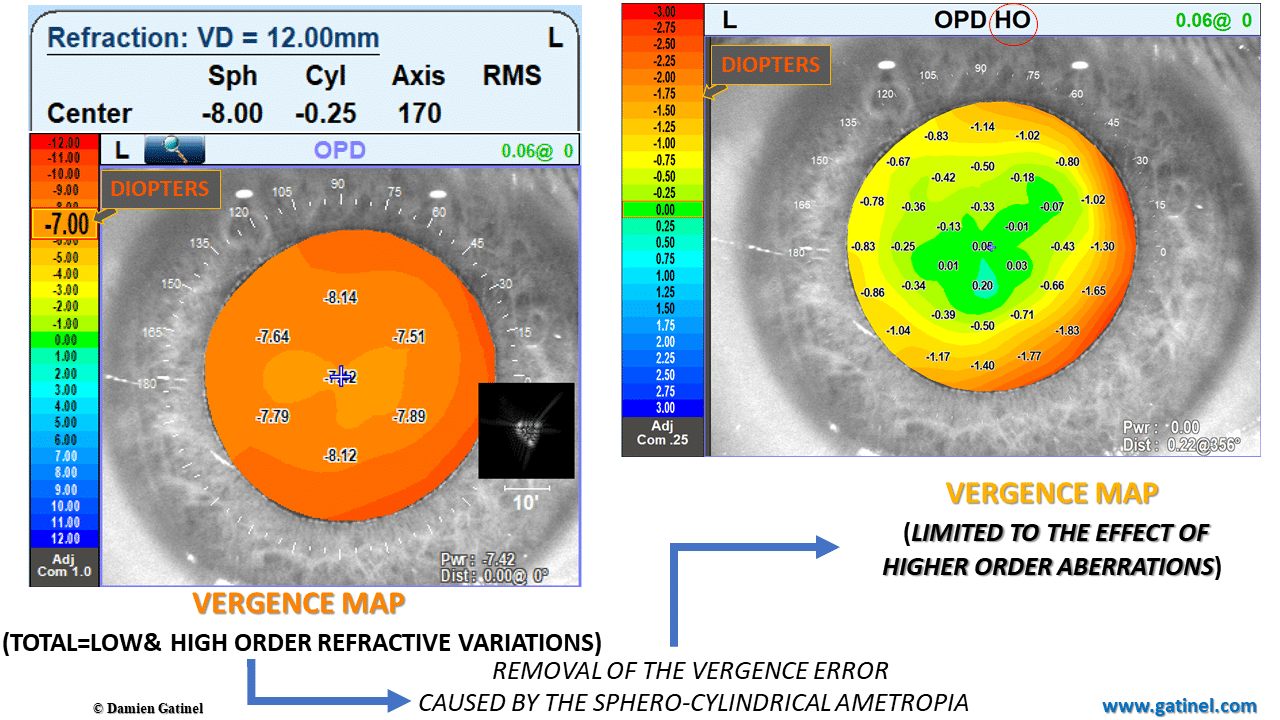
The fluctuations (e.g. a tendency for the myopic error to increase toward the edge of the pupil zone) are caused by the combined effect of the higher order aberrations of the wavefront. Removing the contribution of the objective refractive error allows us to better visualize the specific effect of the higher order aberrations. As expected, this effect is negligible across the center of the pupillary zone and is characterized by a rapid increase of myopic error toward its edge.
This is the dioptric representation of some “positive spherical aberration”.
Preoperative ocular wavefronts
These maps are now generated from the wavefront error collected by the instrument. They correspond to two different estimations of the higher order component of the wavefront error.
On the left, the calculation of the HOAs component has been carried out using standardized Zernike polynomials.
On the right, it has been carried out using the new LD/HD method.
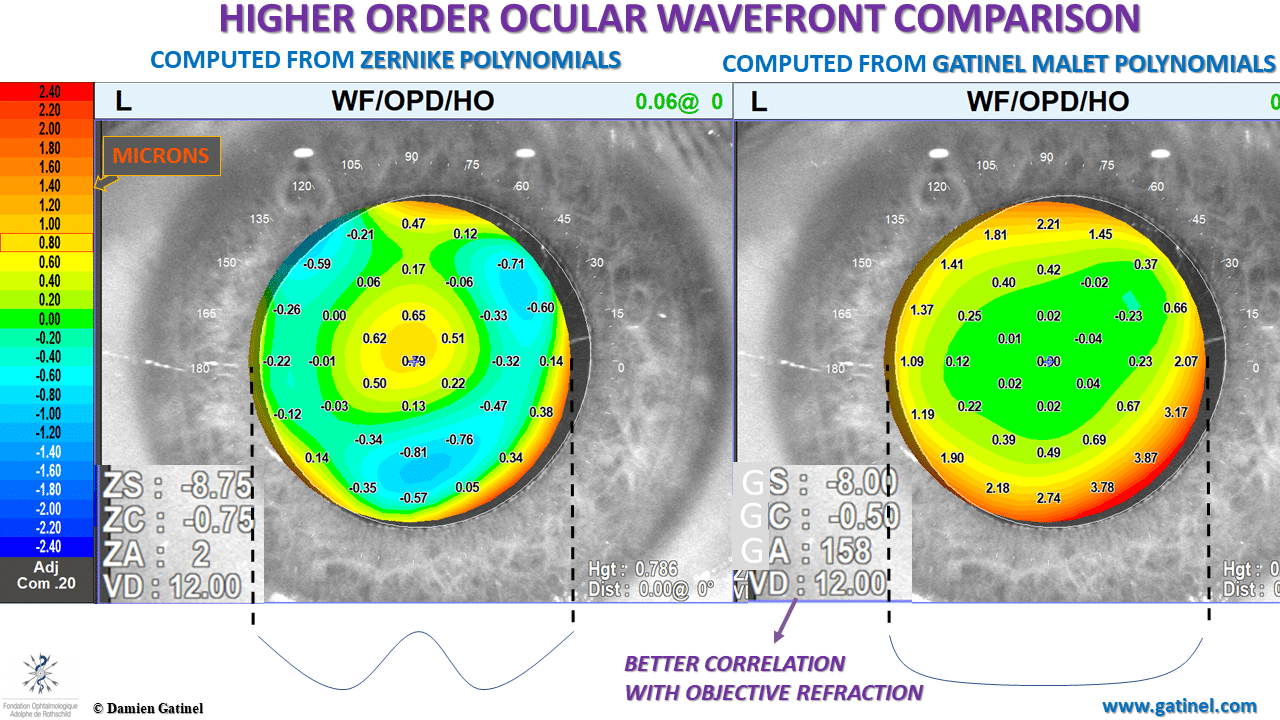
The differences between the maps are explained by the different estimation of the low order wavefront error.
The necessity of using the Zernike spherical aberration mode, which contains a low degree term in r^2 explains the presence of a rapid variation of the phase error in the center («bump »). In other words, the higher order wavefront map contains phase error variations which correspond to lower degree aberrations (correctable by spectacles).
On the other hand, The use of LD-HD method enables the removal of the whole lower order component of the wavefront error. As expected, the residual higher order wavefront error is pure in terms of radial degree 3 or more, and the absence of lower order terms accounts from the central flatness of the wavefront error (compare the schematic horizontal cross-sectional profiles).
The refraction computed from the low degree component with the LD-HD method better correlates with the objective (auto refractometer) and subjective refraction.
Such differences may have important consequences in the field of wavefront based custom photoablations.
Preoperative ocular wavefront coefficients
Preoperatively, there are minor although significant differences between the Zernike and LDHD expansion:
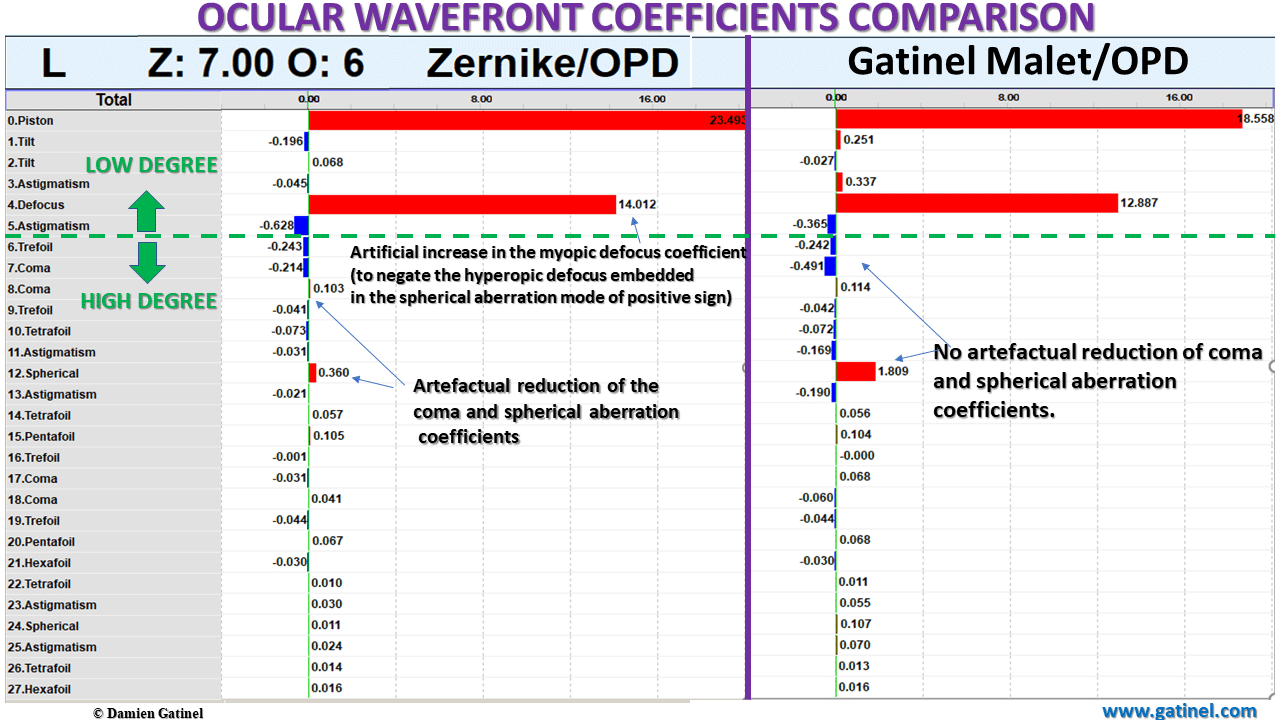
The presence of low order terms in some of the higher order Zernike modes results in significant differences in the normalization coefficients values of these modes. This causes an artefactual reduction of the magnitude of the coefficients of modes like coma, spherical aberration, and secondary astigmatism.
On the contrary, there is no artificial reduction of some of the higher order coefficients (coma and spherical aberration) in the LDHD expansion since the modes of interest are pure in higher order terms.
Point Spread Function and Strehl ratio
The difference between the predicted HOAs Point Spread Functions (PSF) is explained by the presence of defocus in the Zernike HOA computed PSF (left).
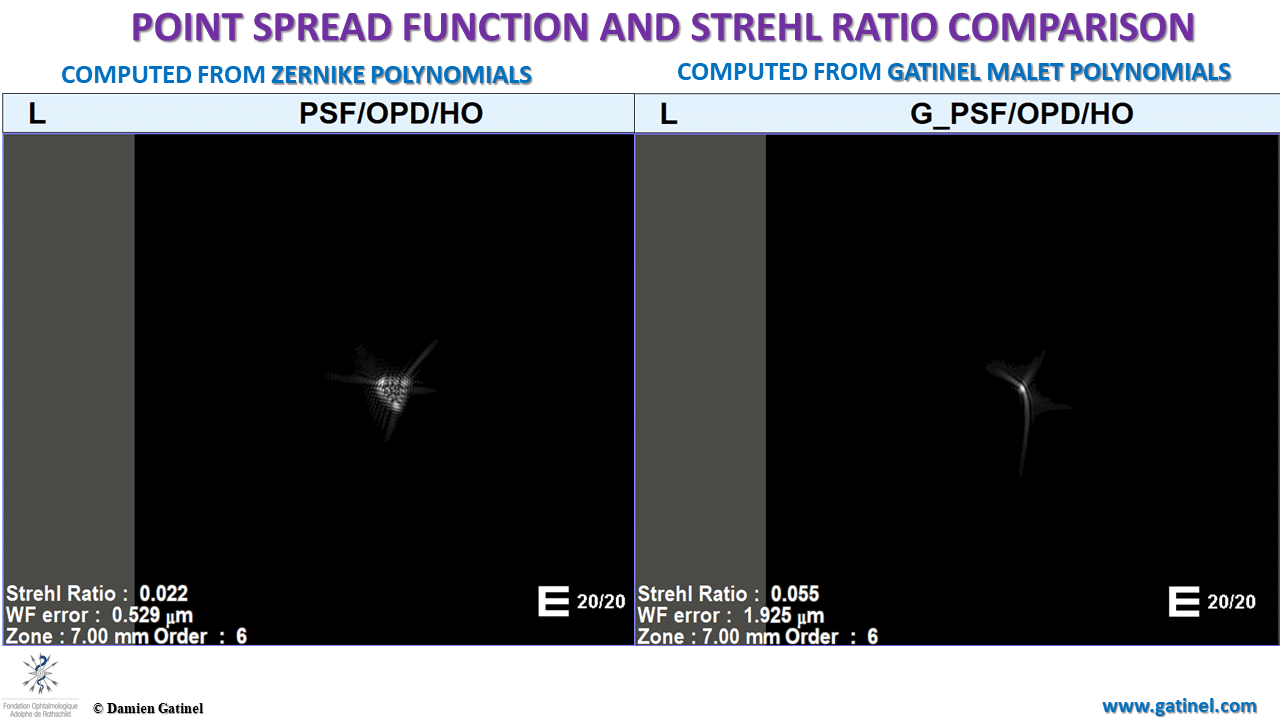
On the right, the image is closer to what is expected, from an optical viewpoint, of a PSF derived from pure higher-order aberrations: a bright focused spot with some tails and halos. The Zernike HO-PSF resembles a blurred patch partially caused by defocusing. This causes a dramatic reduction of the Strehl ratio.
Preoperative corneal higher-order wavefront comparison
The theoretical corneal higher-order wavefront error can be computed from corneal topography data.
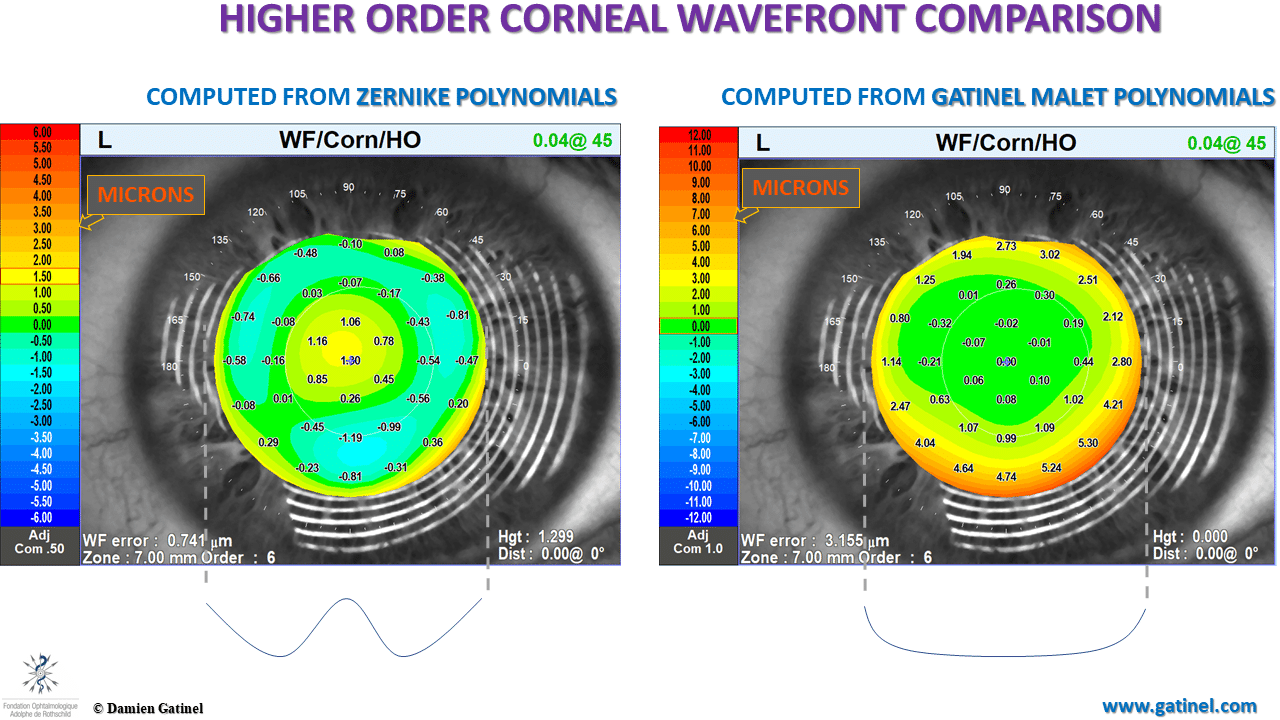
Using the Zernike polynomial basis, the unwanted presence of lower order terms results in a marked central wavefront phase error (central bump of a “sombrero shape”). Such differences may have important consequences in the field of topography based custom photoablations.
Preoperative corneal wavefront coefficients
Noting the difference between the lower order coefficient values is inherent in understanding the differences between the classic Zernike method and the LD-HD method. In the latter, there is no need to compensate for the presence of lower order terms embedded in positive spherical aberration (same mechanisms apply for tilt and coma).
There is no artefactual reduction of the magnitude of some of the higher order coefficients of coma, 4th and 6th spherical aberration related modes.
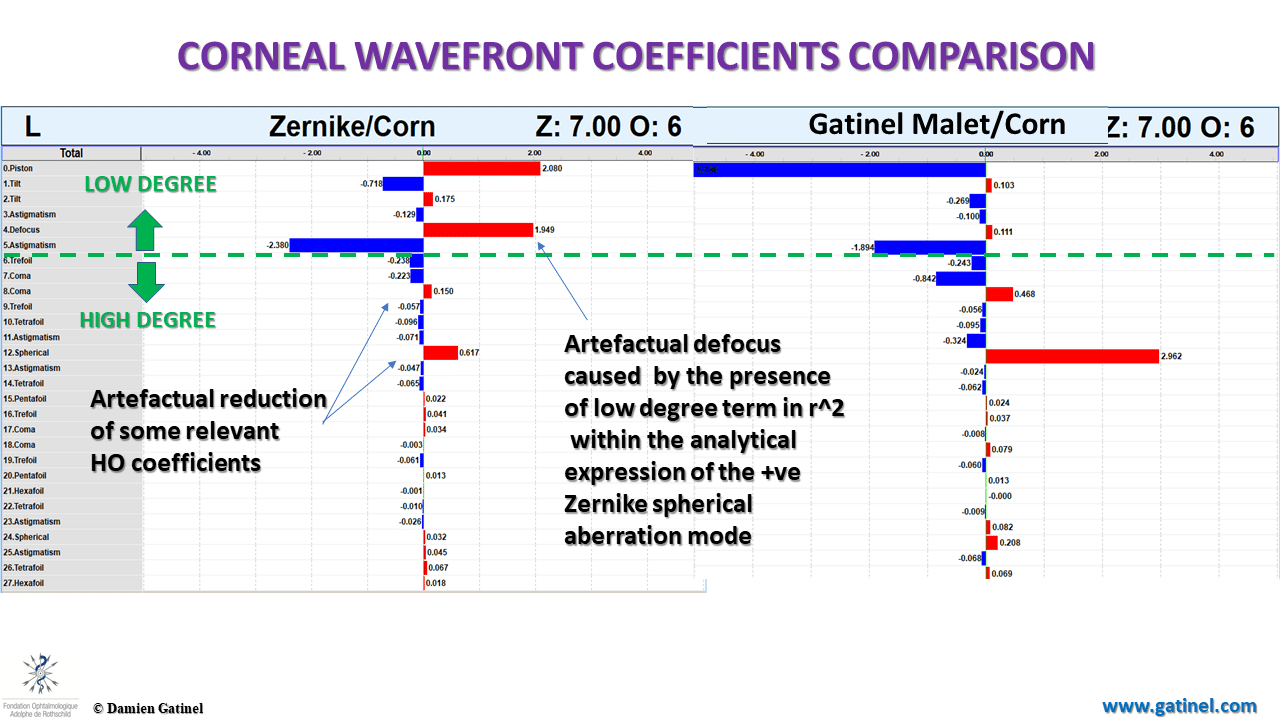
As expected, there is low (minimal) defocus in the corneal wavefront expansion obtained with the LD-HD method.
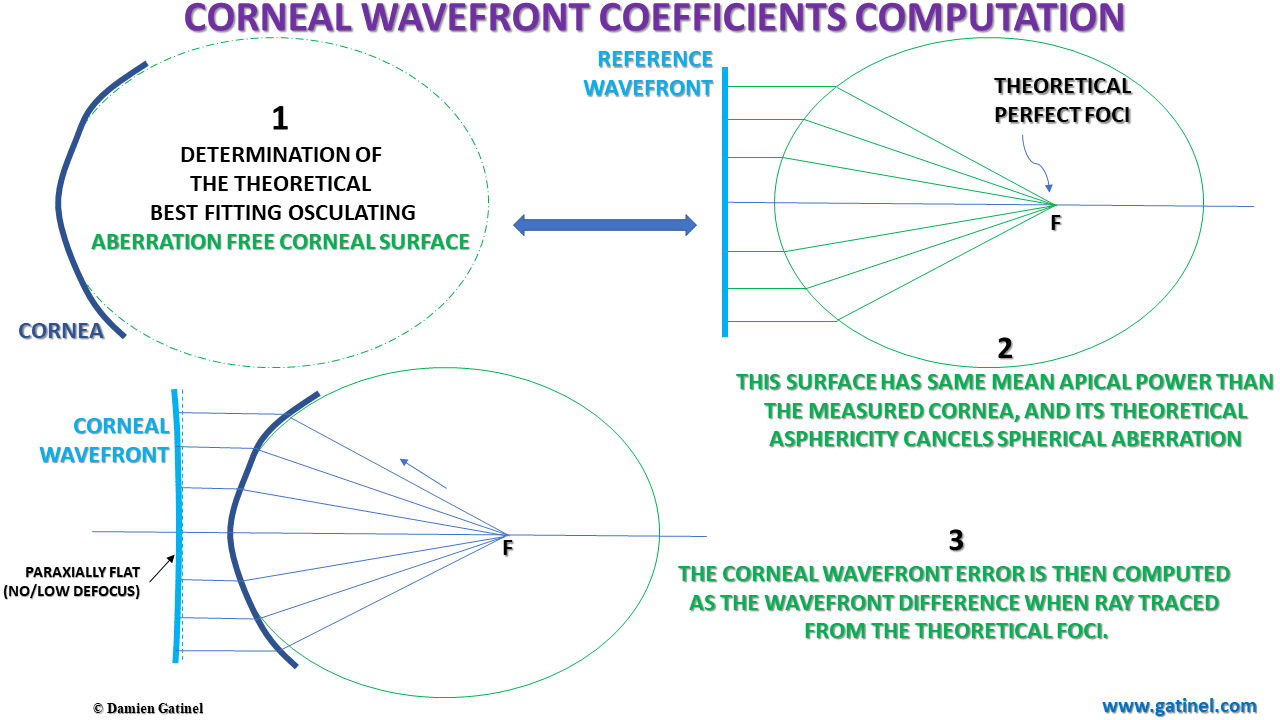
Regardless of the method employed to compute the optical corneal wavefront, it is generally assumed that a certain amount of paraxial defocus value within the wavefront expansion will exist, though it shouldn’t. This is because, unlike the ocular wavefront, the corneal wavefront is computed without the axial length and internal optics data. Hence, the effect of the cornea is predicted in the wavefront itself.
Anterior corneal topography can be used in various ways, such as ray tracing, but one has to assume a certain corneal power, that is defocus. In general, this power is estimated from the central or apical corneal curvature.
POSTOPERATIVE DATA
Six months after the uncomplicated LASIK procedure, the patient reports some eye strain (and fatigue) when working on the computer or reading, and the perception of faint ghost images, predominantly extending horizontally, in dim light conditions around bright light sources.
The OPD-scan III examination is repeated:
The objective refraction shows the presence of hyperopia (overcorrection). In mesopic conditions, the pupil dilates non-concentrically, with a more pronounced temporal expansion, which results in the appearance of a temporal crescent of myopic refractive error. In other words, in mesopic conditions, the functional zone is narrower than the pupil disk area temporally, which causes an increase in higher order aberrations.
In particular, it is expected that “horizontally oriented” aberrations would increase with pupil dilation.
Postoperative ocular wavefronts
The higher order wavefront component computed from the LD-HD method is paraxially flat and devoid of significant tilt:
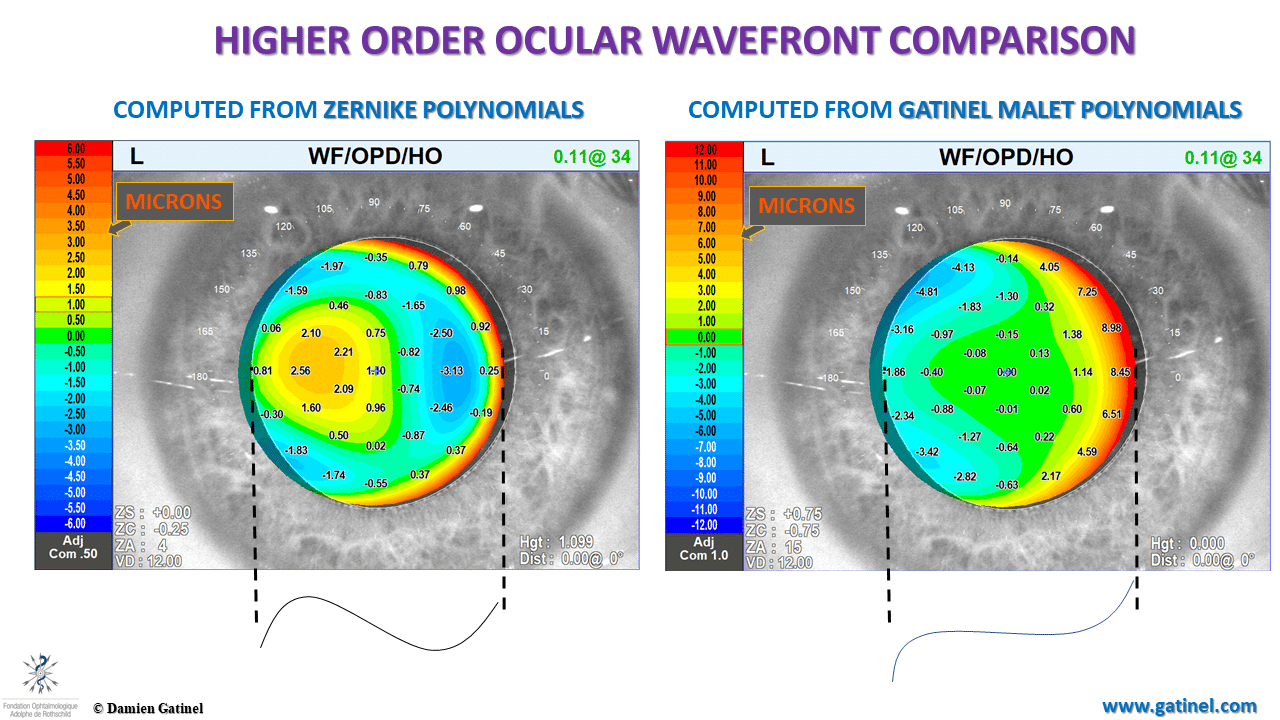
The « tilted » central portion of the Zernike higher order wavefront is an artifact caused by the presence of a tilt term in the analytical expression of the Zernike coma mode. This tilt interacts with the overall shape of the higher order wavefront envelope.
Postoperative ocular wavefront coefficients
There are dramatic differences between the Zernike vs LDHD derived wavefront coefficients, affecting both the lower and higher order components.
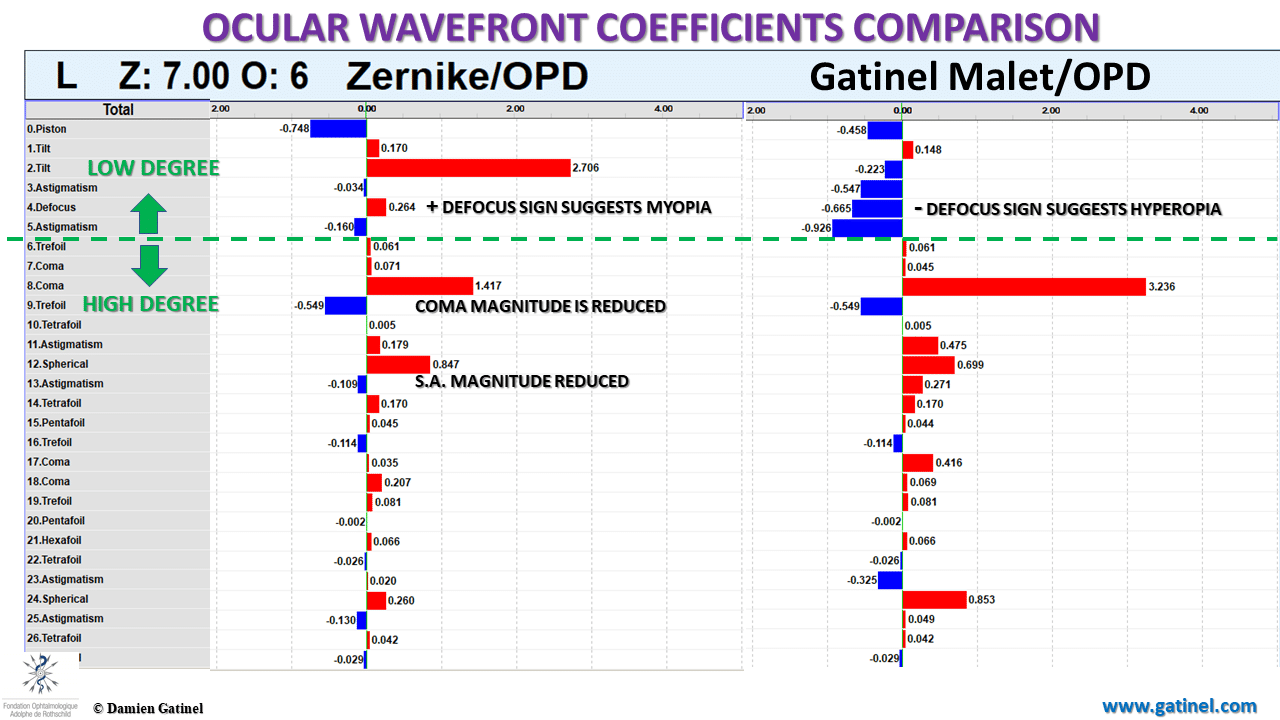
In the Zernike decomposition, the highest coefficient magnitude is horizontal tilt, and the defocus sign is positive (suggesting the presence of myopia).
On the contrary, the defocus sign is negative within the LD-HD decomposition method using the Gatinel Malet polynomials (in accordance with the subjective refraction), and the tilt has vanished.
In both decomposition methods, horizontal coma has the coefficient of the highest magnitude, but the latter is artefactually reduced in the Zernike decomposition.
Retinal image plane optical quality metrics
As expected from the differences in the HO wavefront components, the predicted retinal image plane metrics predict different visual performances.
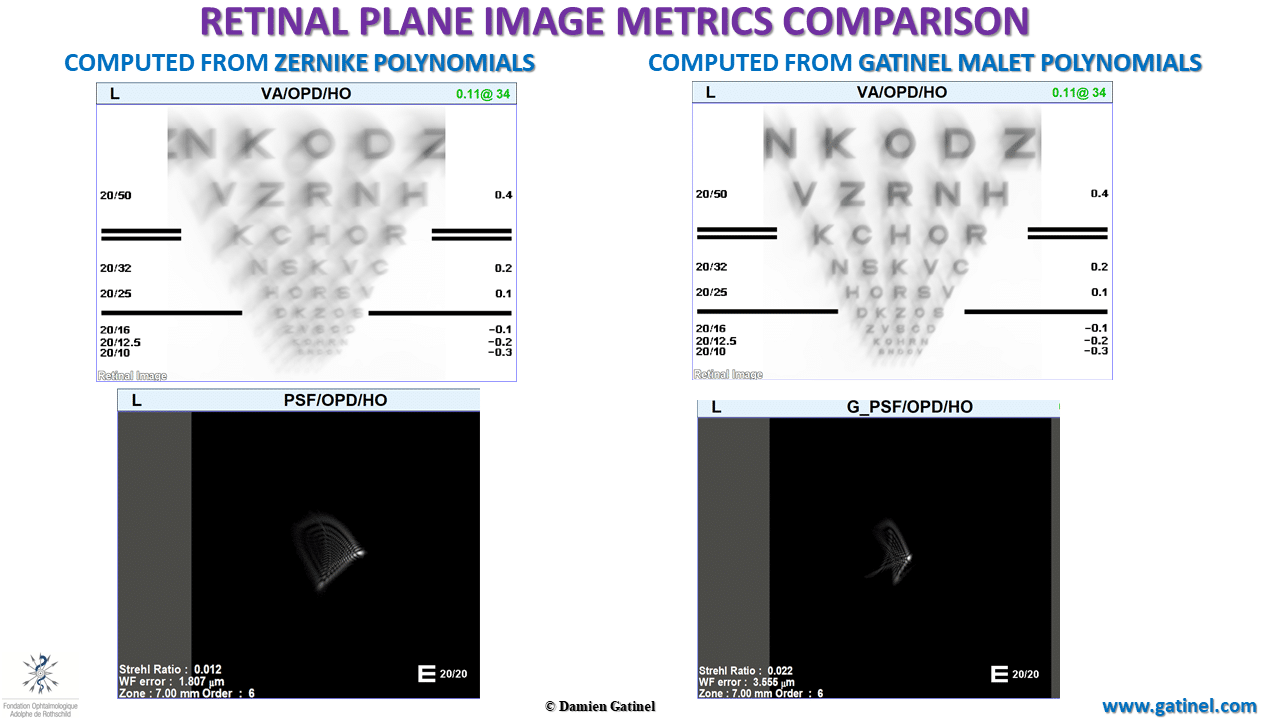
Due to the presence of low order terms in the analytical expression (defocus and astigmatism) of some of the HO Zernike wavefront modes, there is some underestimation of the retinal image plane quality. The Zernike computed HO PSF (left) suggests the presence of some low order defocus and astigmatic blur.
The patient was shown these two simulated vision charts and declared that the image obtained from the LDHD wavefront method better represented his visual disturbance compared to the Zernike method.
For the same reasons (presence of low order terms in the higher order wavefront component), the contrast reduction at the image plane is exaggerated in the calculations based on the Zernike wavefront reconstruction:
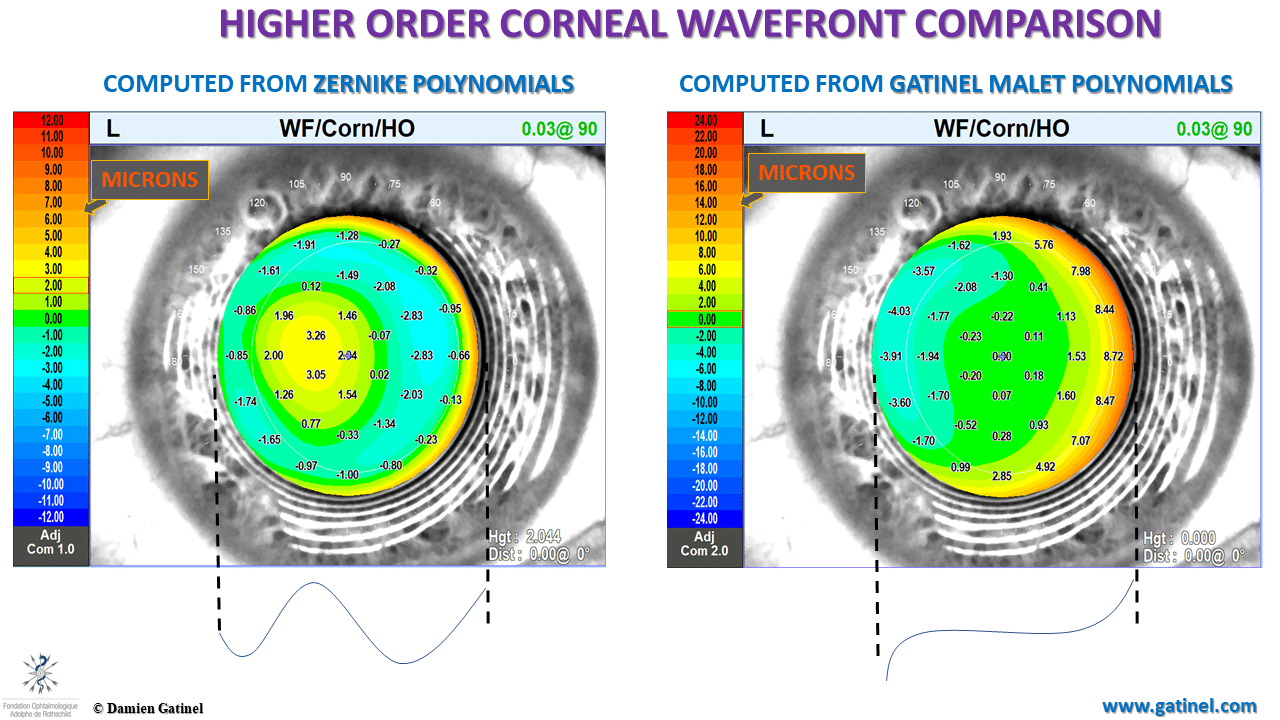
Postoperative corneal wavefront comparison
In the Zernike reconstruction, the higher order wavefront is not flat paraxially, and the overall sombrero shape suggests that spherical aberration is the dominant higher order aberration. On the contrary, horizontal coma is the dominant aberration, and this is better rendered in the LD-HD decomposition method. Higher order wavefront aberrations and the resulting total higher order corneal wavefront component should not exhibit large phase changes within the central/paraxial zone.
Comparison between postoperative corneal wavefront coefficients
The differences between the low and higher order corneal wavefront coefficients are striking.
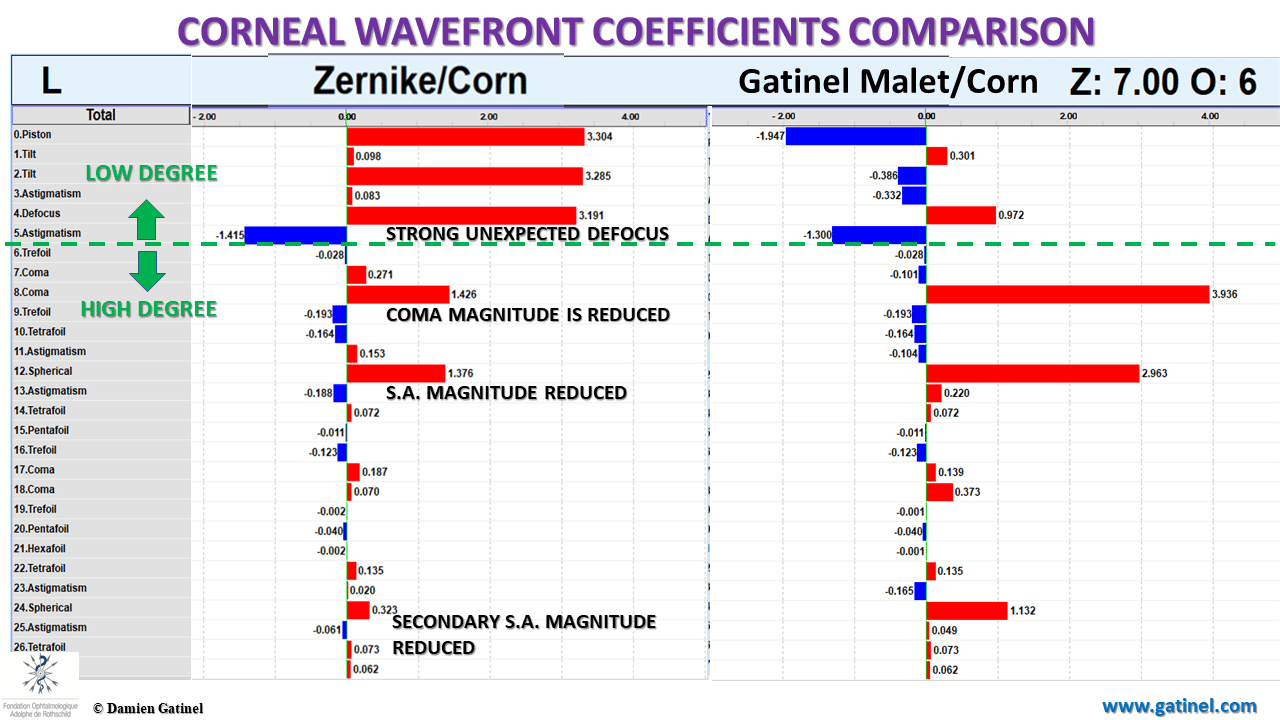
The Zernike reconstruction of the corneal wavefront causes several artifacts: note the presence of significant defocus and tilt modes in the low degree component. The elevation of these coefficients is caused by the necessity to cancel the effect of low order terms embedded in the coma and spherical aberration modes.
This mixture of lower and higher order terms within some modes causes a reduction of their magnitude. Such differences would leave to dramatic differences in the design of a custom topography based photoablation profile.
Conclusion
In conclusion, this case provides insurmountable evidence that the use of Zernike modes might be less relevant for describing human ocular and corneal wavefront errors. We have established a more pertinent method for their assessment and correction.
See other relevant examples and material :
KeratoconusPresbyLASIKOther examplesWavefront sensingZernike polynomials
Laisser un commentaire